 2010-15 Migration Flows
Abstract
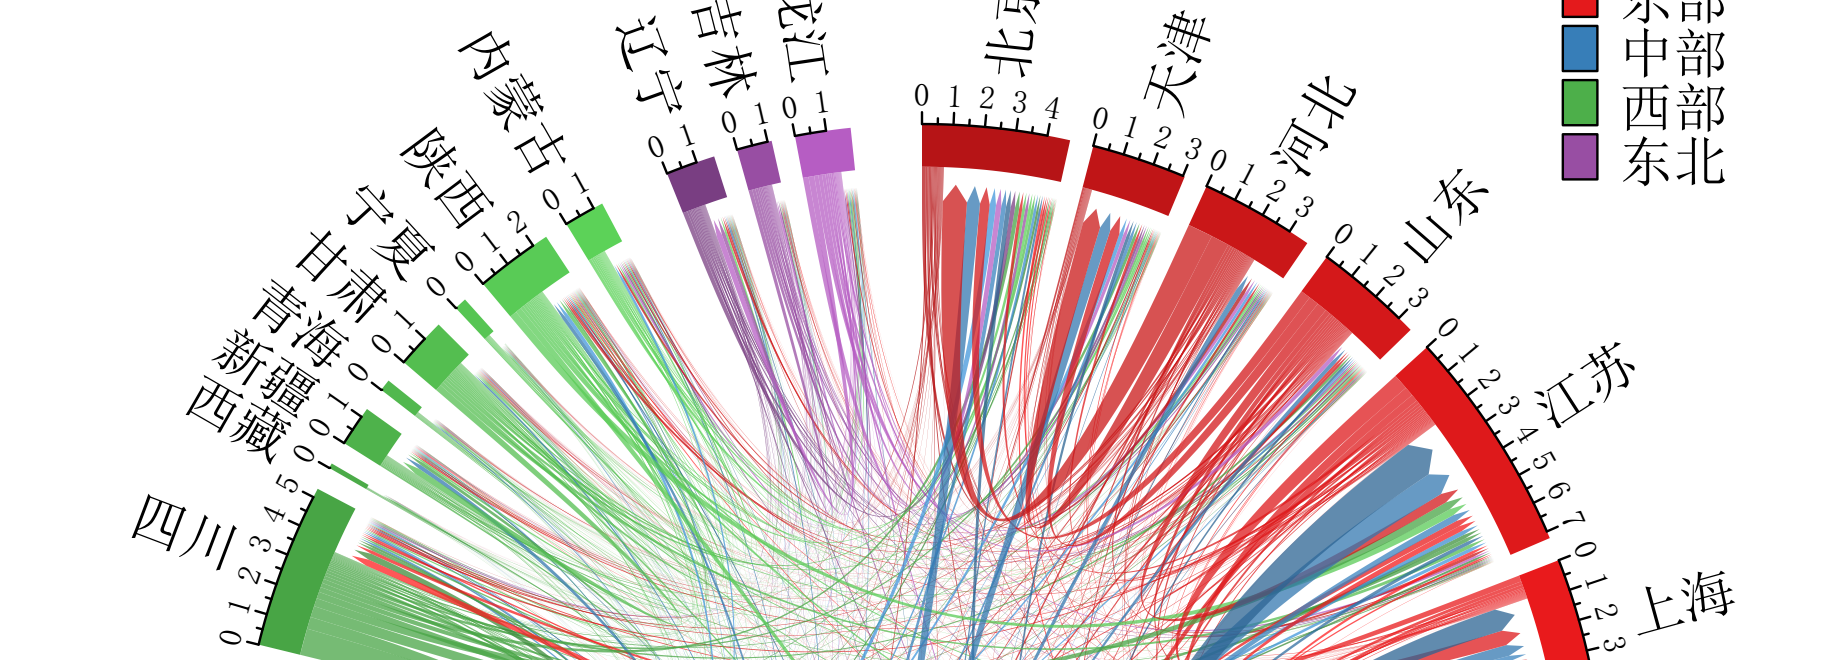
We adapted the chord diagram plot to visualize China’s recent inter-provincial migration during 2010–2015. The arrowheads were added to present the direction of the flows. This method allows us to show the complete migration flows between 31 provinces in China including the direction and volume of the flows. The spatial component was also clearly depicted in the plot using four color palates representing four regions in China (i.e. East, Center, West, Northeast) and arranging the 31 provinces in an approximate geographic order. Besides that, we extend the chord diagram plot to describe China’s bilateral net migration during 2010–2015.
Publication
In Environment and Planning A, 49(11).