The evolution of squad compositions at UEFA European Championships
Visualising where national team players live using chord diagrams.
Euro 2024
Whilst waiting for a delayed flight I managed to update my uefa-ec GitHub repository with new data on the squads at the current European Championships from Wikipedia, and the code to visualise where national team players play their club football using the chordDiagram() function in the circlize R package.
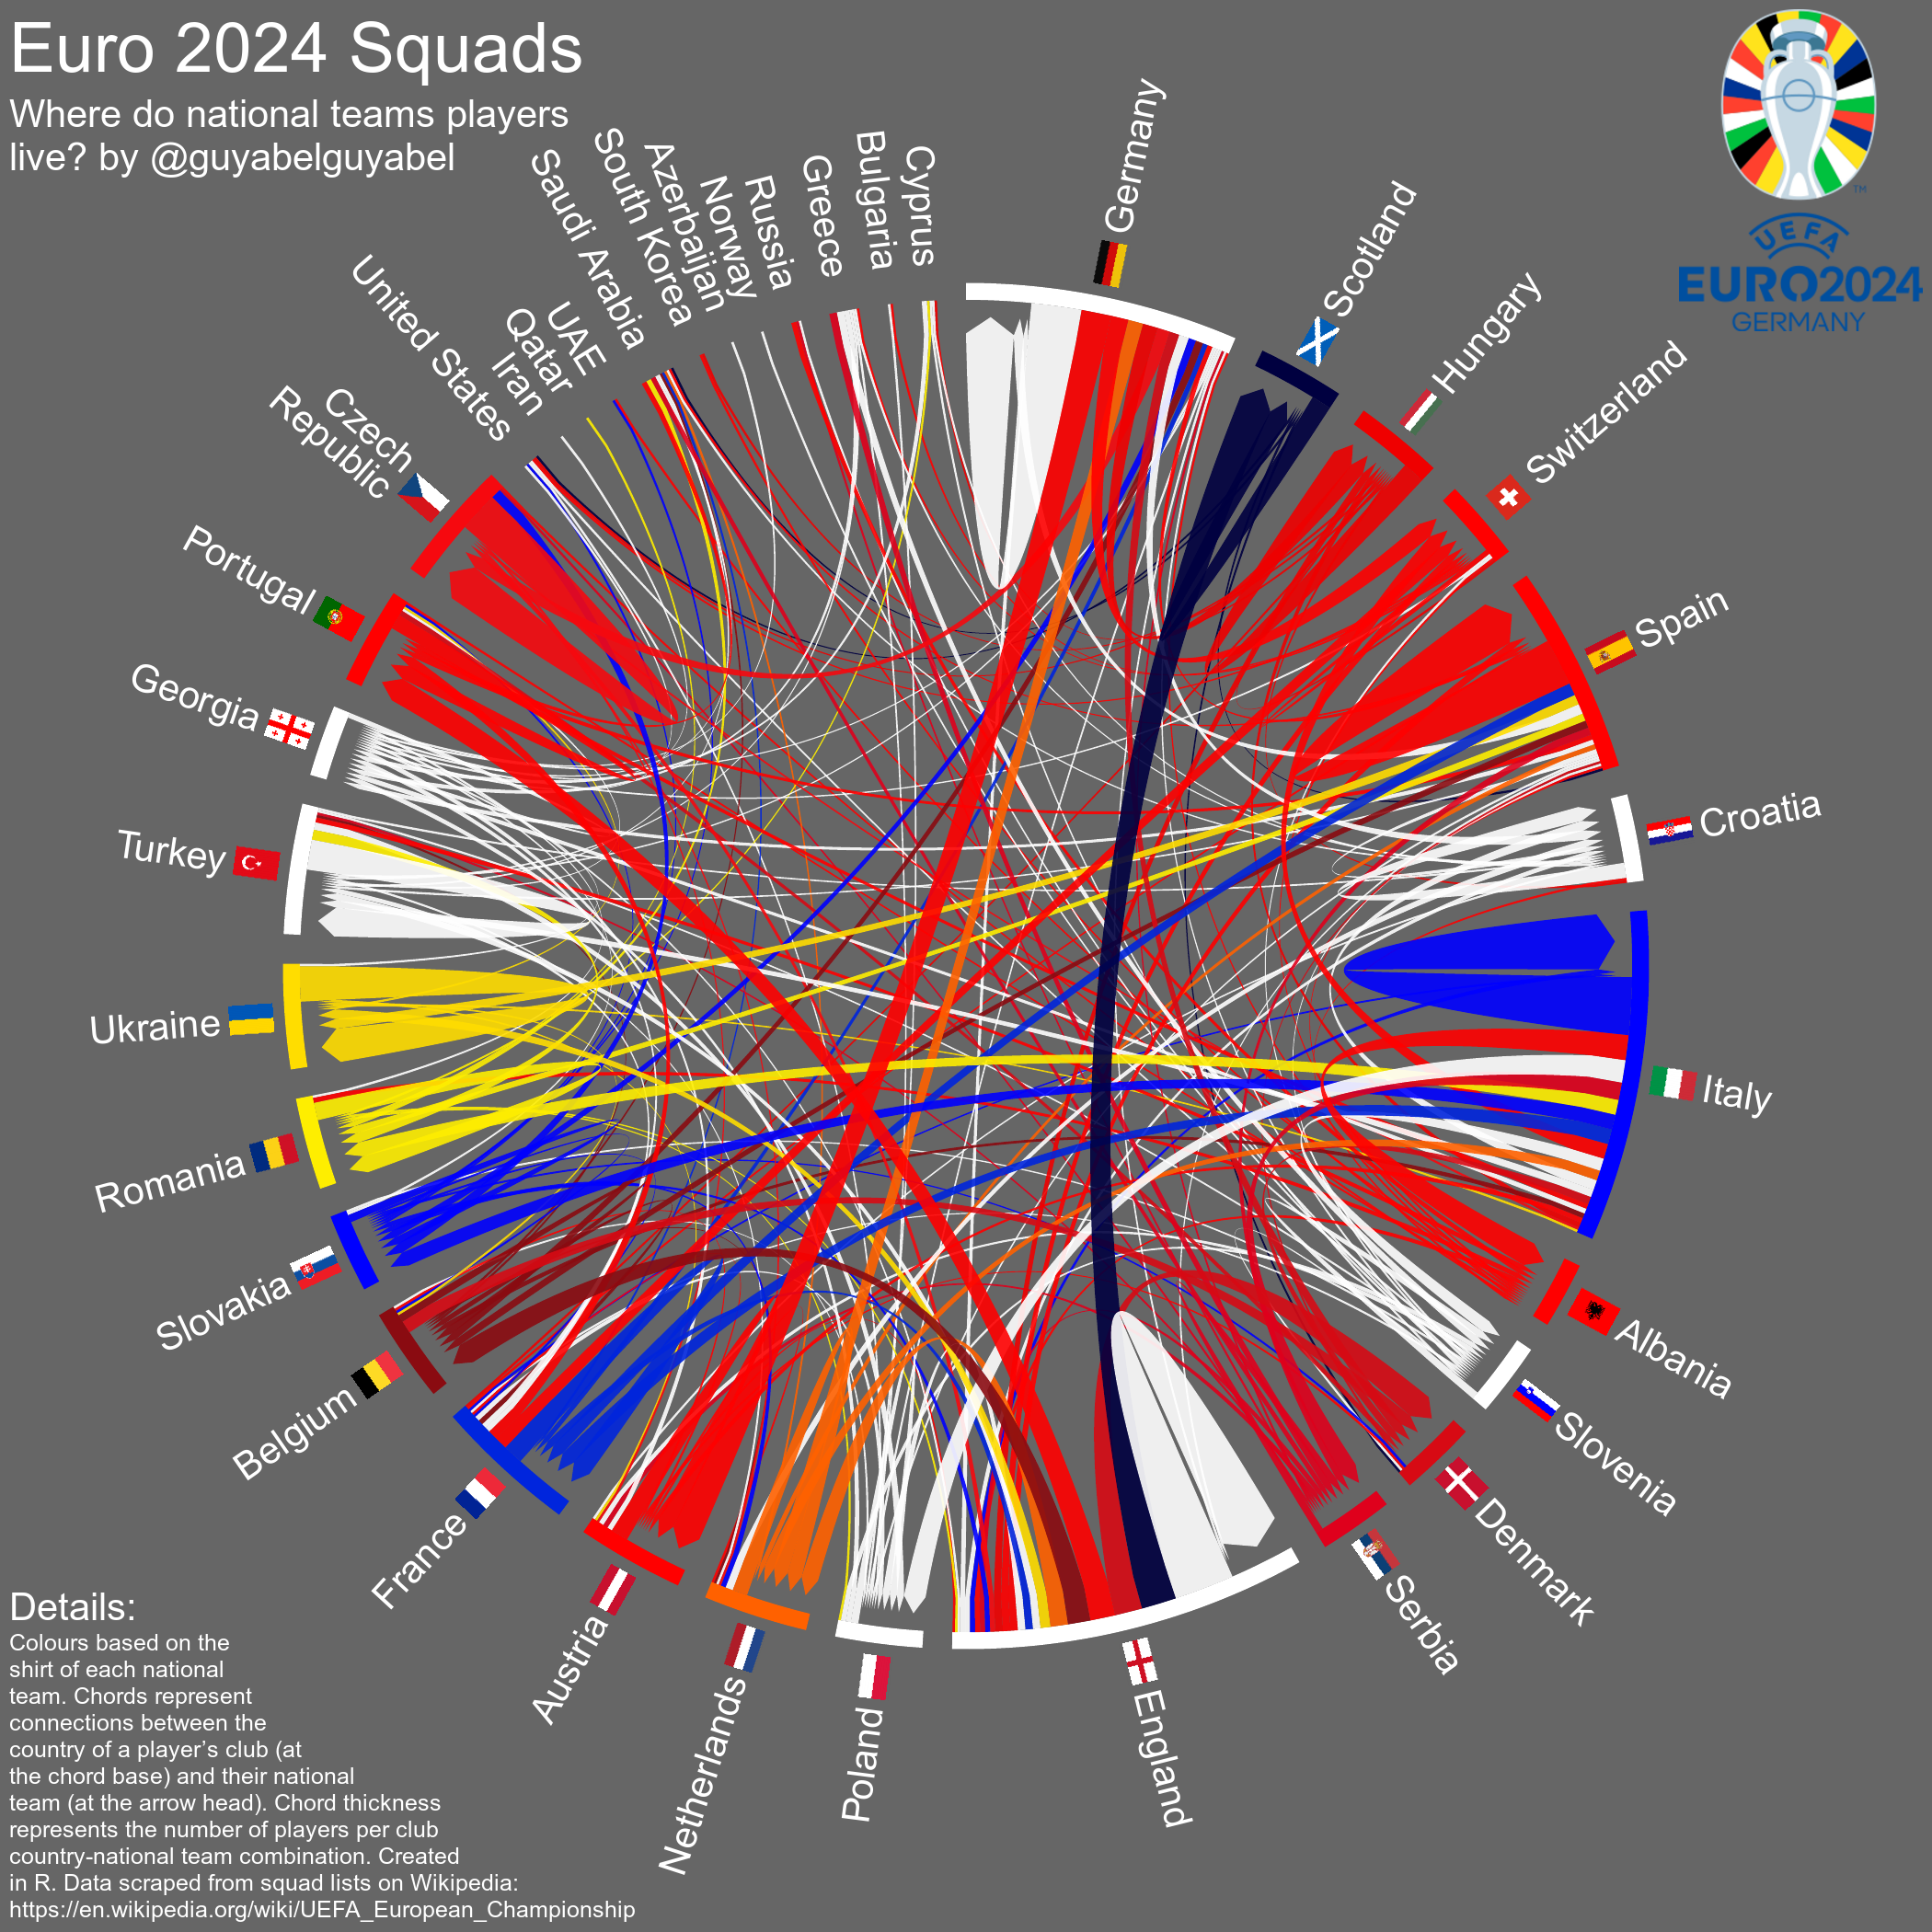
The chords represent connections between the country of a player’s club (at the chord base) and their national team (at the arrow head). The colours of each chord in the plot are based on the shirt of each national team. Chord thickness represents the number of players per club country-national team combination. The countries are ordered by the groups that they will play in during the first round (in the animation below I order the teams by their first appearance at a tournament). The countries at the top of the diagram with no flags are leagues where the national team are not represented at the tournament, but some of clubs have players representing other national teams.
The chords coming out of each sector are ordered by the number of players in each connection. The big five leagues (England, France, Germany, Italy and Spain) host many players. In some squads, such as Albania, Georgia and Slovakia, almost all the players play for club teams abroad.
Evolution over time
Below is some code adapted from previous animated migration chord diagrams to provide a history of the relationships between the club leagues of the players and the national team squads at each European Championship, throughout its history. In most early tournaments almost all the players came from clubs in their home country. Slowly you can see the increasing amount of national team players coming from clubs abroad and the expansion of the number of teams in the tournament.
Note: you might have to right click, select show controls and hit play to start the animations depending on your browsers - right clicking can also allow you to access controls on the play back speed.
R Code
The R code to scrape the squads, flags, kit colours and tournament logos are all in the Github repository. The repo also includes the code to produce the plot and animation. The Data Digest has a nice YouTube tutorial to explain an older version of the code and plots for Euro 2020.
Guy Abel
Professor
My research interests include migration, statistical programming and demographic methods.